The stock volatility we have been seeing does not come without warning. On numerous occasions, I have written a high cost of equity and a low valuation multiple is a recipe for extreme volatility.
As if public enterprises didn’t learn their lesson the first time (see our earlier article, The Folly of Share Buybacks), we are again seeing stepped-up buyback activity. For the S&P 500, during their latest reporting quarter, the firms in aggregate bought back $80.8 billion in common and preferred stock versus $67 billion a year earlier, a greater than 20% increase. As of the latest reporting period, S&P firms in aggregate have reported the following:
Interesting how cash dividends have deceased as a whole. Bristol-Myers ($65 MM), Deere ($117 MM) and Goldman Sachs ($182 MM) were a few paying lower dividends. The fall in long term debt issuance is a reflection of the build in cash resulting from increased free cash flow.
Surprise! Investors get giddy, and we are seeing it with BP.
In fact, BP’s 7.5% rise today questions investor logic, absent a takeover bid, (less than 3% chance), or the price of crude jumping over $ 90/bbl.
This is because under the most optimistic of logical scenarios, one in which is as follows:
(1) BP generates in excess of $3 billion in free cash flow this year and over $6 billion next (events which are extremely unlikely), and
(2) its free cash flows exceed its past three-year average (pre-Gulf tragedy) starting in 2014,
(3) its free cash flows rise by 45% over its past three-year average by 2016, and
(4) we attach no more risk to this cash flow scenario than exists for the median S&P Industrial firm, meaning the increase in risk associated with the past 2 months disappears.
These four assumptions, if realized, result in a current fair value of $43.25. A more realistic fair price is $40.37, which also takes off the table any additional negative event impacting the best-case cash flow forecast.
However, given another nasty surprise, the cost of equity capital (risk) is almost certain to jump over 11% . I say an investment in BP is not worth the risk for a minor return, especially as far greater opportunities, with considerably less risk exists elsewhere, both inside the sector and outside of it.
A 10% fall in the price of energy, even given a market cost of capital, takes the stock down at least 15%. Of course, there is always the possibility that rumor and innuendo could take the stock higher, but I’m not one to invest in the greater fool theory, although that seems to work more often than I care to think. Remember residential real estate?
Pension plans are making news-from local and state governments to large corporations. They are being cut back, eliminated or, for many, in trouble without the workforce recognizing the extent of the problem.
Most firms have been forced to prop up their plan’s health with additional cash contributions, while many other firms are simply hoping the financial markets, as they did during 2009, will bail them out.
Meanwhile, for others, the plans are so underfunded, it is just a matter of time before the inevitable takes hold-larger than expected contributions or a bailout by the Pension Benefit Guaranty Corp. Those firms have been able to make it this far due to overzealous actuarial assumptions which have moderated the true liability. However, with both stocks and hedge fund performance below zero the past three years, which firms stock prices are the most vulnerable?
The list below shows the bottom 20% of that S&P grouping, with each firm on the list underfunded to the extent such amounts to at least 5% of both their total debt (including capitalizing the operating leases, shown as a separate column), and 5% of its current stock price. Many are in much more precarious position, as is shown. In addition, each company on the list has both an expected return on plan assets and a discount rate at least equal to the market average. Of the S&P group of companies, the average investment assumption is 8% and the average discount rate 5.8%, both of which is presently too high and understates the true liability confronting firms with defined benefit plans. The firms on the list have expectations greater than that! Also shown are last fiscal year’s plan contributions, benefits paid and projected benefit obligation (PBO).
The PBO is the actuarial present value of all benefits earned by an employee as of a specified date for service rendered prior to that date plus projected benefits attributable to future salary increases. Indicated is the funded status of a pension plan as either overfunded or underfunded, however, all of these firms plans are currently underfunded as of their latest fiscal.
The underfunded status of defined as the sum of:
Pension – Long Term Asset
minus the sum of
Pension – Current Liability
Pension – Long-Term Liability
Accumulated pension plan benefits are reflected at present value to remain on a comparable basis with plan assets. The assumed rate of return on assets is the discount rate used to arrive at the present value of plan benefits.
If the financial market does not bail these firms out, the alternative could quite well be additional significant and currently unforeseen contributions which will impair reported and expected earnings, cash flows, return on invested capital, and cost of capital.
I would strongly urge all investors in these firms to thoroughly review the actuarial soundness of their plans as this represents significant risk that can be avoided prior to the headlines.
Disclosure: No positions
Kenneth S. Hackel, C.F.A.
President
CT Capital LLC
To learn how to analyze pension soundness and the pension soundness and the pension footnote and reporting requirements, please pre-order “Security Valuation and Risk Analysis“, out this fall from McGraw-Hill, by Kenneth Hackel, C.F.A.
Regardless of how the current earnings season is “spun”, given a boost to operating cash flows (regardless of how “manufactured), we should see an incentive to set up, or re-instate, share buybacks. The folly of buybacks have proven substantial over the past four years, including the large number of firms that have subsequently re-sold the same securities at much lower prices; investors continue to falsely believe in the information content stock buybacks hold.
It is not unusual for buybacks to take place even though free cash flow is subpar, with these entities borrowing to engage in a buyback program.
Share buybacks have been traditionally viewed as an outlet for free cash flow and excess balance sheet liquidity with the intent of bolstering a firm’s valuation. By shrinking the equity base and number of shares outstanding, it is believed, the firm would enhance its earnings and cash flow per share, economic profit, and hence its market valuation. As has been seen by the number of companies which bought back significant amounts of their stock for treasury, and later returning to investors to sell back shares at a considerably lower price, share buybacks are often a poor choice. The loss of financial flexibility and equity cushion was a central reason for the demise of many firms which had acquired large amounts of their own stock during 2007-2008. For most firms, share buybacks are used to offset the dilution resulting from stock based compensation.
Financial theory states that companies that shrink equity by buying back shares or paying of dividends with balance sheet cash and new debt tend to see their cost of capital decline. This occurs for two reasons.
The first has to do with the mystery of what management might wind up doing with the cash. Too often, bad acquisitions burn cash or lower return on invested capital, waste management time and increase leverage. This most often occurs when companies acquire outside of their own industry (Mobil, Montgomery Ward), but also when firms seek to diversify outside of their core competency from within their industry (AT&T, NCR).
As part of the company’s strategy, it evaluates potential acquisitions in the ordinary course of business, some of which could be and have been material. Acquisitions involve a number of risks and present financial, managerial and operational challenges. Integration activities may place substantial demands on the company’s management, operational resources and financial and internal control systems. Customer dissatisfaction or performance problems with an acquired business, technology, service or product could also have a material adverse effect on the company’s reputation and business.
The other benefit concerns the tax shield of interest payments. Using excess balance sheet cash to pay common stock dividends does not change the cost of capital, according to popular finance, as payment is made after taxes, and the entity receives no tax benefit as does a credit against taxes for interest expense. It is the tax shield of interest expense which reduces a firm’s cost of (debt) capital since profits paid to creditors in the form of interest are not taxed. Unlike financial theory, if a firm paid a dividend through borrowing, it could raise cost of capital in our credit model because of the increase in leverage and debt metrics.
The Chapter 8 credit model would not lower cost of capital due to a stock repurchase program. It does not provide cash flow and reduces financial flexibility. It has been observed, in widespread practice over the course of several business cycles, such programs actually wind up raising cost of capital more often than lowering it.
Entities buying back stock in the midst of a large capital spending program significantly raising leverage ratios would be especially prone to increases in their cost of debt and equity capital. Business runs in cycles and even investment grade companies, like Home Depot, have seen higher cost of capital resulting, in part due to large stock repurchases.
Seen too often are share buybacks forced upon management by aggressive and vocal shareholders, hoping a share repurchase program will either support the stock or allow them the flexibility to sell their holdings.
But what if the entity has surplus cash on its balance sheet, low leverage, no promising investment opportunities, and is a consistent producer of free cash flow? Rather than continually shrinking its equity, which has not shown to improve stock valuation, shareholders are best rewarded changing management who can find worthwhile opportunities either within or outside of the firm. Providing cash to selling shareholders has not proven to improve the wealth of the remaining shareholders if ROIC falls below cost of capital.
The road to superior stock performance has always been for management to raise the ROIC, not stock buybacks[1]. Berkshire Hathaway (BRK.A) was a slow growth, stable free cash flow producer until new management arrived, deploying excess cash at every opportunity to buy high ROIC companies, finding hundreds of opportunities, from very small to very large, including furniture manufacturers, newspapers, brokerage, food, and now a railroad. Despite Berkshire outperforming the S&P by a huge margin, Berkshire has never repurchased its own shares. And even today, being a company with a $195 bn. market value, the company is finding no shortage of investment opportunities, of the kind that are generally available to all investors.
BUT BUYBACKS DO NOTHING TO IMPROVE ECONOMIC RETURN
Example:
Aside from the probable loss in financial flexibility, do share buybacks otherwise improve valuation? Take the case of a hypothetical company, Worldwide Electric Co. Think of Worldwide as having two parts, (1)the operating company which produces $ 100 mil in annual free cash flow, and (2) Worldwide’s cash and cash equivalents ( 14.3% of equity) which can be used to buy back its shares. The firm has $100 mil in payables and no other liabilities.
Assume the company generates $ 100 mil in free cash flow (putting aside taxes), with a market value of $ 1.3bn. and 100 mil shares outstanding, so they generate $ 1.00 per share ( including interest), and the stock sells at $ 13 per share.
If they were to use their $100 million in cash to buy back 7.7 mil million shares (at its current market price), the multiple on its shares would fall to that of the operating company, or 12.5, and the company would now have approximately 92.3 mil shares outstanding.
Worldwide’s return on invested capital would remain exactly the same as we exclude interest income from our metric; we are only interested in the cash on cash return. While their GAAP ratios would fall, including the P/E, as a result of the reduced number of shares outstanding, the more vital cash flow return ratio is identical. And by that measure, the company still produces $ 96mil in free cash flow on the same capital base, or a 13.4% return on invested capital. The only differences are the shares outstanding and the reduced cash. If Worldwide had a greater amount of cash on its balance sheet to repurchase stock, the fall in P/E and free cash flow multiples would be more dramatic and yet the return on invested capital would still remain the same 13.4%. The free cash flow multiple falls to that of the operating company, so from the shareholders point of view, their value is not enhanced. And certainly lost is their financial flexibility. If they had balance sheet debt or operating leases, their debt ratios would have increased in addition to the elimination of cash which might have been used for expansion as a low cost of capital.
Under typical circumstances, as we see in our example to follow on Clorox, a large stock buyback can completely eliminate shareholders equity.
[1] For example, a Wall Street Journal article, “America’s New Cash Conundrum,” January 21, 2010, pointed out that over the prior ten years, over half of the companies surveyed had a zero or negative return on their stock repurchases.
Included in Alcoa’s (AA) press release this week was the statement its cash flows would have been even higher had it not been for the ending of its sales of accounts receivables.
What Alcoa didn’t state is that such sales enhanced its prior quarters, with the amount of additional sales, above the prior period (adjusted for normalized growth) to be subtracted from cash flow from operations. Alcoa’s prior periods cash flows, using traditional methods have benefited from such sales. In our analysis we back out such favorable impact to arrive at a normalized free cash flow and operating cash flows.
The sale of receivables is part of the analysis of all asset sales.
Asset Sales
For entities needing to raise cash, asset sales are always considered in addition to external financing. The least costly capital raise will always be considered first, especially if the financial turbulence is expected to be short-term and the cost of debt and equity are high.
The continual sale of inventory for below market prices, or accounts receivable factoring, normally provide an unmistakable warning that should raise a flag for students of cash flow and risk, as the realization price reflects a cost which would not normally be acceptable to a well-financed organization. Asset sales are often a de-facto partial liquidation. Continuing asset sales that take place for lower than balance sheet values are indeed telltale signs.
To improve operating cash flows, companies often sell operating divisions, as they rebalance their portfolio of companies in search of the highest return opportunities. Small asset sales and balance sheet management typically constitute good business practice, and add to free cash flow and reduced cost of capital. Managers committed to weeding out poorly performing business units can significantly enhance their company’s market valuation.
Significance, in accounting parlance, relates to size and whether the failure to report an event as a separate line item would mask a change in earnings or trend. The analyst should determine if the company under analysis has indeed sold assets during any particular reporting period due to weakness in its borrowing capacity, or an attempt to bolster disappointing operation cash flow. Both Enron and Delphi Corp, prior to their bankruptcies, were selling inventory with the understanding they would be repurchased at a later period, a clever way to raise cash but a telling sign of liquidity shortfall.
The securitization of assets for sale into a Special Purpose Entity, as was invoked by Enron, may not, by itself, represent a reason to sell a security or dismiss the purchase of one, especially in light of otherwise undervaluation by the marketplace. In fact, many companies have raised cash via the securitization of accounts receivable, redeploying those funds back into a business which resulted in high rates of growth in cash flows. When viewed under the light of other metrics, asset sales could form part of a mosaic, indicative of a financial risk urging avoidance of the particular security, or to place a higher discount rate on its free cash flow, accounting for the new, higher level of uncertainty.
Entities which have substantial accounts receivables, like retailers, often discount these future cash receipts for immediate cash, as Macy’s did during 2006. The figure below reveals the impact on its average collection period resulting from that sale. Of course, average collection period and similar credit metrics, such as cash conversion cycle, will be distorted by the sale of receivables.
Selling receivables boosts current period operating cash flow and thus must be normalized by the analyst in evaluating historical and prospective cash flows. To do so, one would compute the past 4 years average accounts receivable to sales and apply that to the current year, as if the financing did not occur. At that point, the analyst can evaluate the Operating and Power cash flows for that year, including the sales of receivables.
More importantly, since the upcoming year(s) cash collections will be lower, an updated cash flow projection must reflect the new expected collections, with emphasis on the ability of the entity to retire or recast upcoming debt and other obligations coming due. Macy’s has, according to its “Financing” footnote, $2.6 bn. in principal payments due over the coming 3 years. Since prospective cash flows will be diminished by the present value of the change in future collections, fair value could shift, depending on how the cash from the sale is deployed. In its statement of cash flows, seen is the drop in cash flows from operations, with management reacting to by cutting budgets company wide.
MACY’S, INC. CONSOLIDATED STATEMENTS OF CASH FLOWS (millions)
2008
2007
2006
Cash flows from continuing operating activities:
Net income (loss)
$
(4,803
)
$
893
$
995
Adjustments to reconcile net income (loss) to net cash provided by continuing operating activities:
(Income) loss from discontinued operations
–
16
(7
)
Gains on the sale of accounts receivable
–
–
(191
)
Stock-based compensation expense
43
60
91
Division consolidation costs and store closing related costs
187
–
–
Asset impairment charges
211
–
–
Goodwill impairment charges
5,382
–
–
May integration costs
–
219
628
Depreciation and amortization
1,278
1,304
1,265
Amortization of financing costs and premium on acquired debt
(27
)
(31
)
(49
)
Gain on early debt extinguishment
–
–
(54
)
Changes in assets and liabilities:
Proceeds from sale of proprietary accounts receivable
–
–
1,860
Decrease in receivables
12
28
207
(Increase) decrease in merchandise inventories
291
256
(51
)
(Increase) decrease in supplies and prepaid expenses
(7
)
33
(41
)
Decrease in other assets not separately identified
1
3
25
Decrease in merchandise accounts payable
(90
)
(132
)
(462
)
Decrease in accounts payable and accrued liabilities not separately identified
(227
)
(396
)
(410
)
Increase (decrease) in current income taxes
(146
)
14
(139
)
Decrease in deferred income taxes
(291
)
(2
)
(18
)
Increase (decrease) in other liabilities not separately identified
65
(34
)
43
Net cash provided by continuing operating activities
1,879
2,231
3,692
Cash flows from continuing investing activities:
Purchase of property and equipment
(761
)
(994
)
(1,317
)
Capitalized software
(136
)
(111
)
(75
)
Proceeds from hurricane insurance claims
68
23
17
Disposition of property and equipment
38
227
679
Proceeds from the disposition of After Hours Formalwear
–
66
–
Proceeds from the disposition of Lord & Taylor
–
–
1,047
Proceeds from the disposition of David’s Bridal and Priscilla of Boston
–
–
740
Repurchase of accounts receivable
–
–
(1,141
)
Proceeds from the sale of repurchased accounts receivable
–
–
1,323
Net cash provided (used) by continuing investing activities
(791
)
(789
)
1,273
Source: Macy’s 2008 10K
In many cases, it is less expensive to borrow funds with the creditor taking a security interest in accounts receivables and inventory. This would be a loan, not a factoring agreement where the accounts receivable are sold. In a factoring arrangement, the cost to the firm is typically higher.
When receivables are financed through borrowings, it is shown as a finance activity, even though the actions are basically identical to its sale. Also, by factoring, the firm keeps the loan off of its balance sheet. Another issue to consider is whether the receivables being sold were done so on a non-recourse basis, so that if they are ultimately uncollectable, Macy’s has no further legal obligation. A moral obligation, may exist, however, and must be considered.
The figure below shows Macy’s average collection and payables period for 2003-2009 fiscal years. When Macy’s sold about $ 4.1 bn. of their in-house receivables during 2005-2006, it dropped their collection period, but of course, the company paid a price for the immediate cash. They did reduce total debt by about $ 1.5 bn. but unfortunately they also succumbed to shareholder pressure and expended $2.5 bn. on the repurchase of shares, hopeful the buyback would boost the stock price, which it did not, since their cash flows were weak.
To Macy’s, which had substantially increased its leverage resulting from its $ 5.2 bn. purchase of May Department Stores the year earlier, the cash resulting from the sale of receivables might have ultimately staved off bankruptcy two years later when its business fell due to the recession and loss of market share to competitors, the latter not a atypical byproduct of a large business combination. For sure, management wished the $ 2.5 bn. stock buyback never took place. The $2.5 bn. outflow robbed Macy’s of needed financial flexibility by eliminating a large cushion when its business turned down.
While the sale of receivables does indeed provide immediate cash, it is important to consider why the action was taken, especially for companies that operate on tight margins. For such entities, the sale may eliminate profits those sales initially produced. For them, if the cash is not used to pay down trade payables or other business related obligations, the analyst must question where such cash will eventually come. Because Macy’s wasted funds from the sale on share buybacks, they cut their purchases of PPE in half over the next two years. It is difficult to imagine a large sale of accounts receivable to buy back shares is ever a good idea.
At the end of last year, to avoid having to consolidate its 83% ownership investment in Globalfoundries, which, if undertaken would have harmed its financial results and balance sheet, AMD took the unusual step of renouncing its control in that large enterprise.
Adopted by FASB in June, 2009 for adoption beginning in 2010, FAS 166, Accounting for Transfers of Financial Assets, and No. 167, Amendments to FASB Interpretation No. 46(R), changes the method by which entities account for securitizations and special-purpose entities. FASB 166 relates to the consolidation of variable interest entities, and 167 amends existing guidance for when a company “derecognizes” transfers of financial assets. A variable interest entity is a business structure that allows an investor to hold a controlling interest in the entity, without that interest translating into possessing enough voting privileges to result in a majority. The new standard requires noncontrolling interests be reported as a separate component of equity and that net income or loss attributable to the parent and noncontrolling interests be separately identified in the statement of operations.
Under this recent accounting rule dealing with variable interest entities, which took effect this year, AMD would have been required to consolidate Globalfoundries its debt and income into AMD. By renouncing its control, AMD is merely required to state its investment as a single line entry, even though it may be partially or wholly on the hook for a share, or all, of its debt.
These type of actions, while having little to no impact on cash flow, can nevertheless serve as signals of impending busineess conditions. For if AMD’s position was strong, we doubt such a transaction would be considered. But that’s the result of a firm with large negative free cash flow with high cost of capital-unlike Intel.
No wonder AMD’s stock has continued to fare poorly.
Even though it was not part of Intel’s (INTC) press release, we have constructed a cash flow statement for INTC based on available information.
INTC is now selling at just 15.2x this year’s estimated free cash flow (FCF), down from 16.5 for their prior FY, and below the median S&P multiple of 17.3. This is after adjustments for normalized changes in balance sheet items, without which, as to soon be be reported cash flow from operations will be $2 bil above net income. Working capital and changes in taxes penalized operating cash flow during the quarter while it was aided by stock based comp. and A/P. It was a strong quarter operationally, which was the biggest boost to FCF.
On Monday (see story here), we estimated INTC’s fair value at $23.74; resulting from the current strength in its business, FV, given INTC’s low 8.4% cost of equity, is closer to $25.25. We would expect the stock to move up on the news today.
Disclosure: No position
Kenneth S. Hackel, C.F.A.
President
CT Capital LLC
Take a look again at fair value table for BP. Given a 9% cost of equity (which is quite generous given remaining risk) BP is fairly valued in the upper $30s. So unless you feel another energy shock is on the way, or another event that is going to propel energy prices higher near-term, allowing for a major boost to free cash flow on similar output, I would advise investors sell their shares in BP for other investments offering greater value with lower risk (cost of capital).
Even if a halt to the spill forces share higher, its not worth the risk and would be unjustified given the estimated free cash flows. So, unless free cash flow improves dramatically, not a likely event near-term, investors will be better rewarded elsewhere.
BP has risk and should not wish to be considered by certain investors-consult your investment professional.
Investors and potential investors should not rely on any information contained herein or communicated by any means to replace consultations with qualified investment professionals to meet their individual investment needs. The materials contained herein are for general purposes only. They do not have regard to the specific investment objectives, financial situation or risk tolerance of individual or corporate investors. Investors should consult with a financial professional prior to making any investment decision or investing in any of the firm’s products. CT Capital LLC, its employees, or any associated individual, is not responsible for any investment decisions the recipient of these materials may make with respect to any investment. Data contained herein is gathered from sources believed to be correct and reliable but assume no liability for the accuracy or validity of any material whether written or verbally communicated. Nothing in this presentation should be construed as an offer to sell, a solicitation of an offer to buy, or a recommendation for any security or investment by CT Capital LLC, its directors, officers, principals, employees, agent, affiliates, or any third party.
No employees or clients of CT Capital LLC or credittrends own a position in BP, nor was CT Capital or credittrends paid for preparing this report.
Intel Corporation (INTC) will release its financial results after the US financial markets close.
We spotlight INTC due to its consistent ability to produce free cash flows and strong credit, both of which manifest in a below-market cost of equity capital. INTC is, by Credit Trends, rated “A” for both cash flow and debt, as seen below.
While the model has picked up some deterioration of its credit quality over the past year (operating cash flow adjusted for working capital changes, leases, total debt, ratio of working capital to total debt, pensions, inventory/sales, reinvestment, taxes, others), INTC remains a very strong credit, and is thus accorded our highest rated class.
The table below shows INTC could free up additional free cash flows by reducing its selling, general and administrative expense more in line with its rate of growth. Interestingly, INTC has done this with its R&D even though R&D as a percentage of both sales and cost of sales has declined. This was due to the absolute expense reduction in nominal dollars during its past fiscal year of approximately $100MM. This was quite close to the $91 MM we calculated as corporate “fat” we called for a year ago.
INTC is a low tax rate payer by any measure, but in a higher rate (on a cash basis) and more importantly, a more consistent rate than AMD or TXN. In “Security Valuation and Risk Analysis” we show how taxes should be analyzed for areas of weakness and strength, including its role as a leading indicator. In its last fiscal year, INTC was in a 16.5% cash rate versus the 23.4% rate reported to shareholders. By contrast, AMD was in a 3.4% cash rate and TXN a 16.4% rate. Over the past 6 years INTC’s cash tax rate has averaged 6 percentage points higher than TXN.
As for fair value, given its estimated 7% rise in long-term free cash flows and low cost of capital, INTC is currently about 13% undervalued.
INTC has risk and should not wish to be considered by certain investors-consult your investment professional.
Investors and potential investors should not rely on any information contained herein or communicated by any means to replace consultations with qualified investment professionals to meet their individual investment needs. The materials contained herein are for general purposes only. They do not have regard to the specific investment objectives, financial situation or risk tolerance of individual or corporate investors. Investors should consult with a financial professional prior to making any investment decision or investing in any of the firm’s products. CT Capital LLC, its employees, or any associated individual, is not responsible for any investment decisions the recipient of these materials may make with respect to any investment. Data contained herein is gathered from sources believed to be correct and reliable but assume no liability for the accuracy or validity of any material whether written or verbally communicated. Nothing in this presentation should be construed as an offer to sell, a solicitation of an offer to buy, or a recommendation for any security or investment by CT Capital LLC, its directors, officers, principals, employees, agent, affiliates, or any third party.
No employees or clients of CT Capital LLC or credittrends own a position in INTC, nor was CT Capital or credittrends paid for preparing this report.
Alcoa (AA) worked its assets to eke out some free cash flow during the quarter, as it has the past three years.
However, management’s statement that free cash flow would have been even higher had it not been for the ending of several accounts receivable programs doesn’t hold a lot of water.
Over the past three years, after adjusting for “working the balance sheet”, AA produced on average $1.2 billion in cash flow from operations, or 38% below that reported to stockholders under cash flow from operations. Thus, while AA still has some additional “capture” here, the bulk of the work is done. We are, however, impressed with AA’s fixation on free cash flow, although I point out this is not unusual for debt heavy firms which have been reporting tax losses, like Alcoa. For example, during FY ’09, AA’s cash tax rate was negative, while its effective rate was 38.7%
AA still has an underfunded pension, which surprisingly did not come up during analyst questioning, despite the $600MM stock contribution the company made in its first fiscal quarter. AA still has steep debt payments over the coming few years.
AA appears to be a risky stock I would avoid, although a better than a dreadful scenario, and general equity market rally will likely result in some advance in its shares.
How should balance sheet goodwill be viewed by the equity analyst?
Goodwill is measured as the excess of the purchase price of a purchased business over the fair value of the tangible and intangible assets acquired, minus liabilities assumed. If there is a bargain purchase where the acquirer pays less for the assets than the stated amount, “negative goodwill’ occurs and the buyer is required to recognize such excess in earnings as a gain. This would be recognized as a non-cash event in operating activities.
Goodwill has measurable value to the extent the assets it represents can produce free cash flow in excess of the firm’s cost of capital. Since goodwill represents an economic benefit, to the extent this benefit is impaired, so too must its value, including a possible increase in instability metrics related to the firm’s cash flows. But because the value of goodwill is included in the calculation of return on invested capital, its write-down could distort the analysis of management’s ability to spend and earn a rate of return in excess of its cost of capital. In theory, an entity should in fact write down all assets that do not produce a cash return at least equal to its cost of capital, so those assets reflect economic reality. Impairments, by itself, do not affect free cash flow, and why we look to growth rates in that measure when selecting an investment portfolio.
For the cash flow analyst, the governing rule, FAS 109, Accounting for Income Taxes, does not permit the recognition of deferred taxes related to goodwill that is not deductible for tax purposes. If the assets creating the goodwill are expected to be of indefinite value, the goodwill is not amortized and the related deferred tax liabilities will not reverse until those assets become impaired. The tax treatment of the goodwill depends on the expenditures that created the goodwill. If an acquisition is structured as a stock purchase, no amortization of goodwill is permitted. If the purchase is structured as an asset purchase, goodwill is amortized over 15 years using straight line depreciation. For shareholder reporting, goodwill is not normally amortized unless the assets are deemed impaired.
When goodwill is not tax deductible, any book/tax difference is considered a permanent difference and no deferred taxes are recognized. When goodwill is tax deductible and is being amortized on the corporate return, it creates a deferred tax liability once the amortization period is up. When a company makes an acquisition, it may be required to reclassify its acquired intangible assets as goodwill if the intangibles are not tax deductible, and any deferred tax liability associated with those intangibles will be reversed as a reduction to goodwill.
To see if investors penalize entities which have large amounts of goodwill relative to shareholders equity, all companies (including companies which became inactive through merger or bankruptcy) which had greater goodwill than equity were studied, with no other financial considerations taken into account; if goodwill had been valued at zero for these entities, shareholders equity would have turned negative. For the five years ending November, 2009, this group had a median stock return of 1.4%, virtually in line with the average return of each sector these companies are a member of. The companies had a median market value of $ 1.5 bn., $918 mil in goodwill and $ 436 mil in shareholders’ equity. Based on this one study, it appears investors do not penalize firms having excessive goodwill when making buy/sell decisions.
Because FAS 109 requires for periodic testing for impairment of goodwill, the analyst should consider it in their calculation of shareholders equity. If these assets fail to produce cash flows in excess of the firms cost of capital, it will quickly show in the reporting periods and effect the free cash flow multiple, growth rate in free cash flow, stability of cash flows and associated metrics including cash flow/debt and return on invested capital. Given the above study, any write-down is most likely already reflected in the market price.
With BP (BP) apparantly agreeing to at least $10billion in asset sales (in addition) to the dividend omission, both acts we called for a month ago, it is again time to revisit the stock.
It is quite clear that unless the price of energy rises on the order of at least 10%, or if the market perceived the ultimate cleanup/litigation liability will be below $ 50billion, forcing us to raise the free cash flow estimates in the table (they are in per share), fair value is currently in the mid $30s for BP.
However, if investors perceive risk to be further reduced, its US stock could rise to the upper $30s, as currently indictated by our present value/cost of capital model. This is clearly a fluid situation with no obvious answer-unless you are a buyer of BP’s underlying assets-they are the obvious winners thus far.
Keep in mind we are also penalizing BP for our perceived underfunding of its pension plans, an issue they will need to address within the coming 12 months, a large general financial market rally aside. For now, BP is paying out a large multiple of what it is paying into its plans; we estimate such plans are at least $3billion underfunded at the end of June. This is a sensitive issue for BP having undergone costly strikes and threats of walkouts in the past resulting from pension issues.
The table at the bottom affirms the relationship between stock price valuations and cost of capital. While the free cash flow multiple is also clearly important and carries significant value, and is a far superior indicator than the P/E multiple, it is change in risk that leads the equity market’s direction. Most pundits would agree, as last validated March, 2009. Keep in mind the free cash flow of the firm is the income to the investor. The same cannot be said with earnings!
During bull markets expansion in multiple valuations is commensurate with like growth in free cash flows, pushing those multiples even higher.
During bear markets, even though firms are more managed for risk, the cost of capital rises, as investors demand additional compensation for the increase in exposures. This comes even though valuation multiples are being suppressed.
As the table shows, during June, 1987 (which doesn’t seem that long ago to me) I was warning of impending risk, and finally shortly before the October crash, was quoted in the New York Times: “ The bull market is dead , it’s over.” This quote was repeated the following day.
Several months after the crash, as many firms needlessly fell to ridiculous levels, four stocks in my clients portfolios were bought out. Because of that, I was featured in an Inside Wall Street column in Business Week titled “A Divining Rod for Deal Stocks is Striking Gold” and from that article, correctly predicted no less than 4 additional companies than were eventually bought out. It was just a matter of cash flow, risk and valuation. Nothing, as Warren Buffet would surely note, has changed in how the valuation of financial securities should be performed today. There are new instruments, to be sure, but how one goes about such valuation of risk and reward, will barely change.
Over the past decade and a half ( except for the early 2000s) leading up to 2007, as the table notes, risk remained reasonable for the S&P and free cash flows were growing. At that end point, our metrics clearly picked up the change, a long time prior to the world-wide financial and credit meltdown.
As for where we stand now, and what investors can reasonably expect, the table, our other data and history, point to sub-par (below 8%), yet positive returns over the coming year. The cost of capital, at 9.1% is sufficiently high such that any increase in risk would surely result in a magnified effect on stocks.
True, the free cash flow multiple is in the bottom quartile of its historic range, but the cost of capital is in the top half. This combination of higher risk and lower valuation is almost always a recipe for out-sized volatility. Normally it takes years to see the type of reduction in risk necessary for a prolonged expansion. If that seems excessive, recall stocks have declined over the past decade. This, however, should not preclude investors being exposed to stocks. With 10-year Treasury’s under 3%, investments in firms with a clear spread between their cost of capital and their return on that capital should bring superior returns to their stockholders, given a below-market multiple for those assets. This has always been the case and always will, in a free society (sovereign risk is one of our cost of capital metrics).
We will attempt to bring you some of those firms in this space. We will also point out firms which are selling at inexpensive valuations, but behind the financial curtain, are really risky securities to be avoided.
HISTORIC COST OF EQUITY, FREE CASH FLOW MULTIPLE AND S&P FAIR VALUE
Example: At the beginning of this year Alcoa (AA) transfered $600MM in stock to a master trust, which can later be sold, but will still be outstanding. This is stock (44.3 MM extra shares) which will reduce all financial measures-earnings per share, cash flow per share, return on invested capital…… And what’s more, Alcoa needs to place more cash into its still underfunded plans!
But Alcoa is not the only firm with such a need. There are many thousands like Alcoa, and at least 20 public firms have announced in-kind contributions over the past year, according to a search on EDGAR, the SEC database.
A couple of weeks ago there was a story of a U.K company which put whiskey futures into its pension plan to shore up funding. I would remind you this was not the first of its kind. Public firms have placed non-cash (in-kind) assets onto its plans for a long time—for instance, a number of years ago US Steel placed timberland into its plan and many firms have contributed stock of its publicly traded subsidiary companies. Years ago, some firms placed company stock into pension plans as a takeover defense. Is it possible Alcoa was doing the same?
Department of Labor approval is required for in-kind transactions in order to protect the interests of the participants.
It’s all part of cash flow analysis. Why? Because when firms understate their pension contribution, as Alcoa has been doing, they are overstating their cash flows. Stock contributions could also aid prospective free cash flows as the contribution is a tax-deductible expense and, by preserving cash, could be a value-enhancing and accretive transaction. For firms operating at a loss, the tax-deduction, if a loss-carryover credit remains, could be entitled to an additional refund.
Stay tuned! Alcoa had negative free cash flow during its first fiscal quarter and was only able to show positive cash flow from operating activities for its last fiscal year from “working” its balance sheet. On the positive side, they have been aggressive at reducing its corporate and downline overhead. They used derivatives and swaps, but as hedges. Also, their cost of sales was somewhat artificially bloated last year due to a halt to a tax benefit in Italy. Alcoa still has a ways to go in streamlining, which will aid free cash flow, as its growth rate in key areas is still high in relation to its growth in cash flows, as normalized and adjusted. Alcoa can easily free up several hundred million dollars in free cash flow from additional expense cutting, according to the proprietary data of our firm CT Capital LLC.
If you’d like to learn more about cash flow and risk: Pre-order “Security Valuation and Risk Analysis” McGraw-Hill, on Amazon or other online book stores.
Sell-side analysts and investors are, as they should, scouring to find the next Apple Computer.
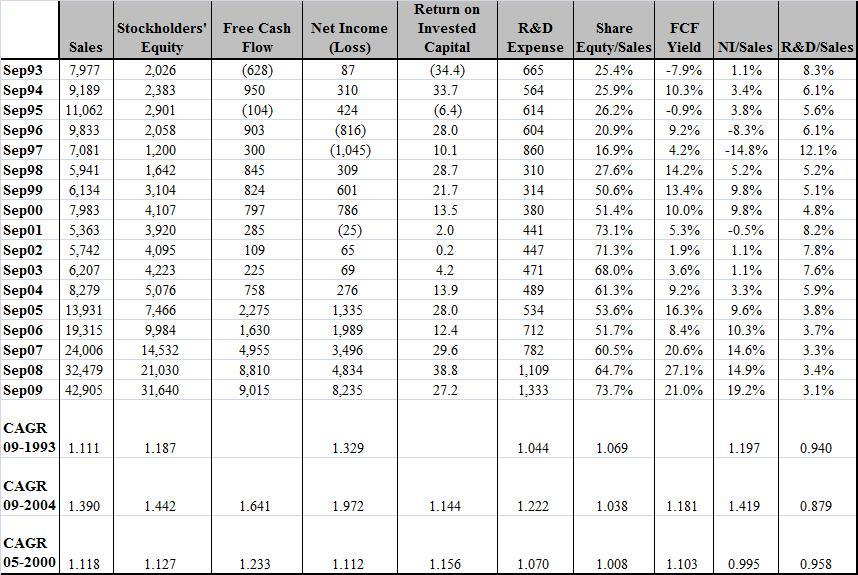
In order to help the process along, we ran our proprietary software, with a few popular metrics capsulized in the table below.
What is surprising from the table below is that investors had quite a few years to buy stock in Apple when it was between $50-$100 per share, for at that time the company was already showing a powerful rate of growth, and the ability to produce superior free cash flow and return on its invested capital. Over the ensuing five years, Apple has been able to reduce its risk parameters, which we measure as its cost of equity capital, and which we will delve into in additional blogs in the weeks ahead.
As the table shows, for the period 1997-2009, Apple showed a compounded rate of sales growth of 11.8% per year very similar to its growth rate in sales between 2000 and 2005.
In addition to the metrics in the table, we reviewed at least 60 other fundamental metrics, from tax rate, cost of sales, and other financial stability variables, to R&D efficiency, patents, pensions and other post-retirement, purchase agreements, commitments, litigation risk, use of cash, growth in certain metrics compared to others, etc.
We believe we have the most comprehensive fundamental database that exists!
Let me say, before I go further, I have not found the next Apple Computer, if indeed there is one out there. The closest company in all metrics was Google, but picking Google is no fun, besides being within 20% of fair valuation.
From the initial screens, firms dropped out for many reasons, some financial, some credit, many “other,” such as pending litigation. Some firms were buying back stock, which Apple does not, and which we have long felt is a waste of shareholder cash. Share buybacks do nothing to enhance shareholder value and certainly nothing to improve return on invested capital (ROIC).
With that said, what investor would be against a double, which we believe our recommendation offers.
OPEN TEXT CORP.
Open Text (OTEX) develops and supports enterprise software specializing in Enterprise Content Management (ECM) solutions. It has strategic alliances with SAP AG, Microsoft Corporation, and Oracle Corporation. They have the second leading market share in its field at 18%, versus IBM’s 22%. ECM is essentially software that manages everything from invoices, mail spreadsheets and any other business content important to the firm. Open Text brings forth a best practices approach, combining features of the leading software vendors such as IBM’s Office, with those of Oracle, and SAP. The partner represents 10% of OTEX license revenue as their biggest partner.
OTEX has a diversified global and customer base of leading industrial, government and financial firms. Sales are 53% North America, 39% Europe and 8% Asia and other.
The recent fall-off in OTEX shares is creating good value for investors. Its shares, having reached $50 in May, due to a disappointing quarter from Europe and Asia, is now trading at $38. Over the past 5 years, revenues have risen by a compounded rate of 21.9% and free cash flow by 39% per year, a rate which is now obviously slowing considerably, but, whose long term growth approximates that of Apple. Recall Apple sputtered in quite a few periods itself.
OTEX is seeing bigger swings in its quarterly GAAP results due, in part, to recent acquisitions making seasonality more pronounced. Such swings are being created by governmental expenditures, a large customer of recent quarters resulting from the most recent acquisitions. Even though earnings are showing greater inconsistency, free cash flows are remaining strong. In fact, the firm has stepped-up hiring in Canada, where business remains robust.
With a market value of $2.1 billion, Open Text currently sells at 11.4 x free cash flow versus 16.5 x for the S&P Industrials; 15% of its current market value is in cash which will see a significant build, ex acquisitions, over the coming years. Over the past three years its operating cash flows adjusted for balance sheet changes are roughly similar to its operating cash flows-this signals the management has not been engineering its balance sheet to raise cash, which is what one would expect with a strong, consistent producer of free cash flows like OTEX.
Of equal importance is OTEX’s return on invested capital (ROIC) of 18.5% compared to its cost of equity capital of 9.1%, below that of the median S&P cost of capital of 9.2%. Cost of capital has risen of late due to greater volatility in its financial results. By comparison, EMC’s ROIC is 15.6%. The firm has shown a positive spread over its cost of capital in each year but one year since 2002, but still produced free cash flow in that year. The firm is very much a value creating entity, in good part from well-priced acquisitions. In this regard, management has stated it will be utilizing its upcoming free cash flows for acquisitions rather than buybacks. Acquisitions are small and thus have greater chance for success as integration and financial risk are reduced.
OTEX has benefited from a very low cash tax rate versus an effective rate, from large loss carryforwards (many from acquisitions) for which it is only allowed to utilize the credits over time. It has large foreign loss carryforwards. Of the total, $26 MM is domestic and $406 MM foreign. Expiration is not a concern. Its most significant tax jurisdictions are Canada, the US and Germany. Cash taxes should remain low for the coming five years, at which point the economy should hopefully bring up the most recent growth rate. In just two of its past six years, has OTEX paid greater than $7MM in taxes.
Although not debt free like Apple, owing to its acquisition program, its fixed charges, including that related to pension are easily serviceable from operating cash flows, including debt reduction from free cash flows. Its discount rate related to its pension is, at 6%, is high but, as adjusted, adds little to overall liabilities. The fund is underfunded by $14.8 MM . Its annual service and interest cost is less than $1MM. OPEX has a 7 year term loan at LIBOR plus 2.5%, expiring in 2013 which they should have no trouble, given current conditions, extending. They are also employing a derivatives’ strategy as an interest rate collar having a $100MM notional value. Collection period and days payables outstanding reflect a healthy concern. OTEX uses a limited cash flow hedge for foreign currency.
Given normalized 10% long-term growth, and 18x multiple, which would be conservative given its consistency measures, its weighted average and equity cost of capital, and 3% inflation, fair value is estimated to be in the low $80’s, a price which we feel should be realized within the coming three years.
OTEX has risk and should not wish to be considered by certain investors-consult your investment professional.
Investors and potential investors should not rely on any information contained herein or communicated by any means to replace consultations with qualified investment professionals to meet their individual investment needs. The materials contained herein are for general purposes only. They do not have regard to the specific investment objectives, financial situation or risk tolerance of individual or corporate investors. Investors should consult with a financial professional prior to making any investment decision or investing in any of the firm’s products. CT Capital LLC, it employees, or any associated individual, is not responsible for any investment decisions the recipient of these materials may make with respect to any investment. Data contained herein is gathered from sources believed to be correct and reliable but assume no liability for the accuracy or validity of any material whether written or verbally communicated. Nothing in this presentation should be construed as an offer to sell, a solicitation of an offer to buy, or a recommendation for any security or investment by CT Capital LLC, its directors, officers, principals, employees, agent, affiliates, or any third party.
No employees or clients of CT Capital LLC or www.credittrends.com own a position in OTEX., nor was CT Capital or credittrends paid for preparing this report.
Most corporate managers and economists believe productivity measures lie at the top of determinants of value creation and corporate health. For that reason, it is a recurring theme during meetings with investors and in regulatory filings, as expressed in a September, 2009 8-K filing for Kraft Foods (KFT) concurrent with their bid for Cadbury PLC:
“A strong pipeline of cost-savings initiatives will result in higher productivity and better margins as part of its three-year plan.”
We will see that while productivity is certainly an important factor which could lead to higher cash flows, its positive bearings are primarily confined as a measure of consequence to the current or soon-to-be free cash flow producer. For, if a firm’s products are met with insufficient demand, and the inputs under which they are produced do not generate satisfactory cash flows, it would be rare for productivity improvements to be able to turn the business around. If the entity is a satisfactory producer of free cash flow, then productivity improvements can indeed lead to even greater free cash flow and a higher security price. For this reason, top line growth and cash flow from operations are more important valuation and cost of capital metrics, than productivity. In fact, productivity measures are an over-rated metric.
During periods of slow growth, or expectations of slowing growth, managers often pursue a downsizing strategy, including layoffs, efficiencies, and reduction in the number of manufacturing facilities, all in an effort to improve long-term productivity. But what can realistically be expected from such actions?
Corporate executives who are continually reviewing their internal portfolio, enhancing their products and lines of business, filling in strategic gaps where necessary to improve core competencies, while eliminating and streamlining those assets that underperform, with an eye on cash flows, typically see higher returns on invested capital than those entities which simply look to shed labor as a quick fix solution.
This is an important distinguishing factor in CT Capital’s cost of capital credit model. While the model considers productivity boosting measures as value enhancing, it is not awarded the large weighting most investors believe exists, and for companies which are not positive producers of cash flows, its weighting is zero. The weaker the cash flows, the lower the importance of enhancing productivity is to cost of capital improvement. If an entity has no prospect of ever generating free cash flow, its equity value, as a going concern, is at best zero, regardless of how many units it produces.
The workforce and productive capital and plant can be set once current and projected operating and free cash flow are reasonably estimated; it would be imprudent to match workforce and plant with units of production or revenues if the entity is not capable of generating long-term free cash flow.
Determining the optimum labor force as being a function of sales or unit output does not reflect upon an enterprise as a cash flow maximizing entity but rather as a unit producing entity. Determining output based on profits may not leave distributable cash to the owner of equity. The corporate managers and analyst must therefore determine the level of output that places free cash flow at its highest level , both today and prospectively.
Free cash flow is maximized at that point on the chart where labor is most efficient. If the current level of employment cannot produce satisfactory free cash flow, management must seek a lower cost labor pool, downsize the labor force, become more productive, raise prices, reduce other expenses, or lastly, sell the asset. If, by virtue of such action(s), the entity turns into a free cash flow producer, it has value to its equity owners.
Debt covenants pertaining to the entity’s most restrictive requirements must be calculated in each reporting period and all covenants that are disclosed must be reviewed for closeness to violation. Each quarter, we determine which debt, income, working capital and other covenants might be exposed over the coming two years.
If the entity might be required to raise capital to reduce leverage to avoid violating a condition, the likelihood of such a raise must be appraised, as should the need for, and probability for success of (including cure resulting from), an asset sale. The violation of a covenant requires the assistance of investors and creditors and thus the relationship with such parties must also be assessed. Although some covenant violations are relatively easier to cure than others, such as a violation caused by a change in an accounting standard, the entity must stand ready to address remedies to any current or future violation.
The effect of, and possibility of, cross-defaults must be explored, including an examination of the entity’s holders of debt securities, should the possibility of breach exist.
Any forbearance issued would result in a large penalty to cost of capital. If the entity is unable to bring its debt payments current, foreclosure and bankruptcy are imminent. Even if the entity can satisfy its creditors, it often comes at a large cost to equity holders.
If the analyst believes it more likely than not a violation will occur and a remedy questionable, the entity’s cost of capital would be marked up at least two percentage points, with the amount dependant on the severity and likelihood of a cure. If a probable violation could result in bankruptcy, the mark up to cost of capital could be in excess of 20 percentage points. At this stage, analysis becomes one of asset and liquidation values and re-organization cost estimates.
Kenneth S. Hackel, C.F.A.
President
CT Capital LLC
A good question,and one that is soon to haunt many stock investors.
How?
The median S&P firm assumes their defined benefit plans will be able to return 8% on their plan assets, far short of that which appears reasonable. Even with yesterday’s 3.1% rally, stock returns have been quite negative in almost every period over the past decade. And what about real estate? For firms that thought commercial properties would raise their long-term returns, those returns have been poor as well. No help there!
With the economy, including employment, lagging, is their any reason to believe financial assets will return to the 8% annual level? We think not.
And if firms decided to terminate their plans and place those assets in insurance annuities? Forget it, as annuities are yielding about 4.5%, depending on the contract being written and the risk the pension sponsor is willing to take back. This compares with a median discount (settlement) rate of approximately 150 basis points higher.
Aside from the exorbitant investment return assumption, sponsors are also benefiting from other liberal actuarial assumptions, such as the spread between the investment assumption and the salary assumption, the latter now 4%, on, average. The problem is that the investment assumption is a more powerful variable, as it applies to both the active and retired workforce.
For pension plans that were underfunded 2 years ago and received the benefit of last years financial market rebound, the chances are they have returned to underfunded status, probably requiring stepped-up contributions. To the extent they hold this off, they are overstating their cash flows.
It is an area worth exploring- as investors in GM learned.
The highest percentage of net present fair value of an equity security is derived from the most immediate free cash flows. However, since BP is expected to produce slim free cash over the intermediate term, an investment may still be warranted, according to the estimates below.
We do not recommend an investment in BP, as higher success opportunities exist, and the probability of the much written about buyout is, as we see it, less than 10%. Additionally, BP’s pension fund requires contributions of at least $1.5 billion more per year than is currently contemplated, making even our estimates quite uncertain. However, as seen below, if the estimates were achieved, only 10% of BP’s current fair value is derived from the free cash flows of the current and next three fiscal years.
Our point is the coming three years should not be the determining factor to an investment in BP if the company can at least stay free cash flow neutral during this time.
Only if one believes BP’s free cash flows will be negative for the coming three years, and subsequently be unable to resume growth in that key metric, should an investment be avoided, and a short position established.
On the contrary, if an investor believed the added liabilities resulting from the Gulf disaster would diminish free cash flows such that BP were free cash flow neutral (or slightly negative) this year, marginally ($3 billion positive next year) and then slowly regain free cash flows such that it would surpass its past three year free cash flow average of $ 11 billion during the 2016 fiscal year, BP’s current fair value would rise to the high $30 area.
With interest in stocks seemingly waning, a potential boost could be on the way-thanks to the U.S. Congress via financial regulation.
It is now a given that proprietary trading and derivatives activity are going to become a smaller part of financial firms balance sheets-effecting large investment banks and insurance companies. The benefiting outlet of such financial intermediaries could very well be their private equity businesses.
JP Morgan, for their 2009 fiscal year, reported about $80 billion in net derivatives receivables versus just $7.3 billion in private equity.
Goldman Sachs reports private equity as part of their $146 billion in alternative investments, and is probably no greater than 10% of that asset class.
Although a minority of the private equity assets of such firms are currently in publicly traded firms, that could easily change, given today’s low multiple valuations and the extended investor time horizon assumed in private equity deals.
To the extent such large financial firms are forced to curtail current lucrative areas as a result of new regulation and oversight, the beneficiary could very well be an increase in private equity and M&A activity, the result of which would be a positive turn in investor confidence, valuation multiples, and the cost of capital.
If valuation levels are so inexpensive, doesn’t it stand to reason merger activity and buyouts would be sprouting?
After all, ten year AA’s are yielding 4.1%, or an approximate after-tax cost of just 2.9% for the 30% cash payer.
While the cost of equity capital is substantially higher-9.2% for the median S&P Industrial, a weighted average cost of capital, assuming a 20% cash, 60% debt 20% equity deal, is approximately 3.2%, given today’s cash yield.
If free cash flow is as high as has been reported during the past earnings season, not to mention the expected growth by security analysts, one would logically assume buyouts to be flourishing. After all, if one believes the free cash flow numbers being reported as accurate, the gap between that number and the cost of capital would add significant value to shareholders. After all, wouldn’t you invest in firms with a free cash flow yield of 8% if you could borrow at 3.2%?
The reason we are not seeing more M&A activity is simple. The free cash flow, as is being defined by analysts is incorrect, that of operating cash flow minus capital expenditures. They are not making the important adjustments to cash flow from operating activities to divine the real free cash flow number, which is lower than being reported.
To learn more about this, order “Security Valuation and Risk Analysis’, McGraw-Hill.
Acquisitions are typically value-destroying undertakings for shareholders, and are considered a negative signal for shareholders and creditors. Many companies look upon acquisitions as a growth strategy without a clear plan for synergies and the creation of additional free cash flow. Most acquirers overpay. While financially flexible firms often have the capacity for acquisitions during economic downturns, when prices would be lower, they most often wait for economic expansion. The most successful business combinations are those which build upon established core competencies.
Underperforming entities which attempt to improve their performance by buying well-regarded competitors normally run into trouble, as a “best practices” approach typically succeeds when both parties to an acquisition are already successful.
There are many notable examples of large companies failing in a business combination: AT&T’s purchase of NCR, Time Warner’s purchase of AOL, Applied Material’s acquisition of Etec and Damler’s acquisition of Chrysler. In each of these cases, the entity being acquired had a cost of capital in excess of its ROIC.
When final demand in a particular industry shows signs of slowing, or firms have excess cash on their balance sheet, it is not unusual to see merger activity pick up. At this stage, most failed mergers take place.
But not all mergers are value-destroying. Acquisitions grounded on cash flow, as opposed to “filling in gaps” or shortfalls in revenues or product, have a greater probability of success. And, if the acquirer can easily reduce the cost structure, free cash flow can increase significantly, lowering cost of capital. Exxon’s purchase of Mobil resulted in points deducted from its cost of capital.
Some of the more easily cut costs are duplicative departments and cost savings in key expense areas, such as finance and treasury, advertising, technology, insurance and employee benefits. Manufacturing, including the supply chain and transportation can also results in significant savings. If the acquired entity has been mismanaged, new management can quickly turn the cash flows is a positive direction.
Successful business combinations are marked by experienced managers who have shown a history of success with such integration. When this is the case, the merged entities combine various departments and put additional pressure on vendors for cost savings. Difficulties are more easily overcome as experienced teams work together toward a common goal, pulling in employees who can solve unique problems. Vendors often feel obligated to cut their selling prices under the fear of losing the relationship. Landlords are also under pressure to hold back increases as leases come up for renewal as good, strong tenants are often difficult to replace, and also act as a draw to the property. It is thus important the analyst weigh the effect of a business combination on tertiary parties. If a supplier is weakened resulting from a business combination, the price for an important input could rise.
There is not a single firm that measures risk as we do. As you know, we have been bearish on stocks for the good part of a year. Even when stocks were reaching new post-credit crisis highs, we did not bulge.
Why?
Because every firm measures risk using the same old, worn-out, models that base risk off of volatility or non-distributable earnings.
We measure risk using the most important factors to a business. Items including sales growth, sales volatility, cash burn, credit spreads, ability to roll over debt, foreign risk, insurance, possible loss of a patent or key executive, taxes, and over 60 other variables.
Everything we do is more intensive.
From how we define free cash flow which includes excess expenditures to invested capital which is based off of our proprietary free cash flow.
Maybe you would benefit from learning these credit and cash flow methods?
If you are interested in becoming a better securities analyst, pre-order “Security Valuation and Risk Analysis” available at all online book outlets.
I doubt the merger talk making today’s news will lead to a buyout of BP.
There is just too much unpredictable risk involved and the size of any buyout too large ($100 billion+), to say nothing of probable earnings and cash flow dilution, for such a deal to have merit.
As for Exxon, the name most prominently mentioned, I would be shocked if they accepted the risk a buyout of BP would entail, especially given a glut of oil going into a period of a worldwide economy showing clear signs of fragility.
While we have written we expect BP to engage in at least $10 billion in asset sales, which should be part of a program to bring the cost of capital down, and which should aid the stock price,a full out buyout is quite unlikely.